
MIS Course Syllabus 2026: Excel, SQL & Power BI से बनें Job-Ready MIS Executive
📚 Table of Contents
Complete MIS Course Syllabus 2026 covering Advanced Excel, MIS Reporting, SQL, Power Query, Power BI, DAX, dashboards and real-world projects. Learn practical MIS skills at KAiSH Computer Institute, Lucknow and prepare for MIS Executive, MIS Analyst and Reporting roles.
📌 Quick Summary
MIS Course Syllabus 2026: Complete Guide to Excel, SQL & Power BI Looking for a MIS Course in Lucknow that can help you build practical, job-orie...
This article is written for beginners who want to learn and build a career in MIS Course Syllabus 2026: Excel, SQL & Power BI से बनें Job-Ready MIS Executive.
MIS Course Syllabus 2026: Complete Guide to Excel, SQL & Power BI
Looking for a MIS Course in Lucknow that can help you build practical, job-oriented reporting and data analysis skills? The KAiSH MIS Training Program is designed to take students from basic Excel knowledge to professional MIS reporting, SQL data analysis and Power BI dashboards.
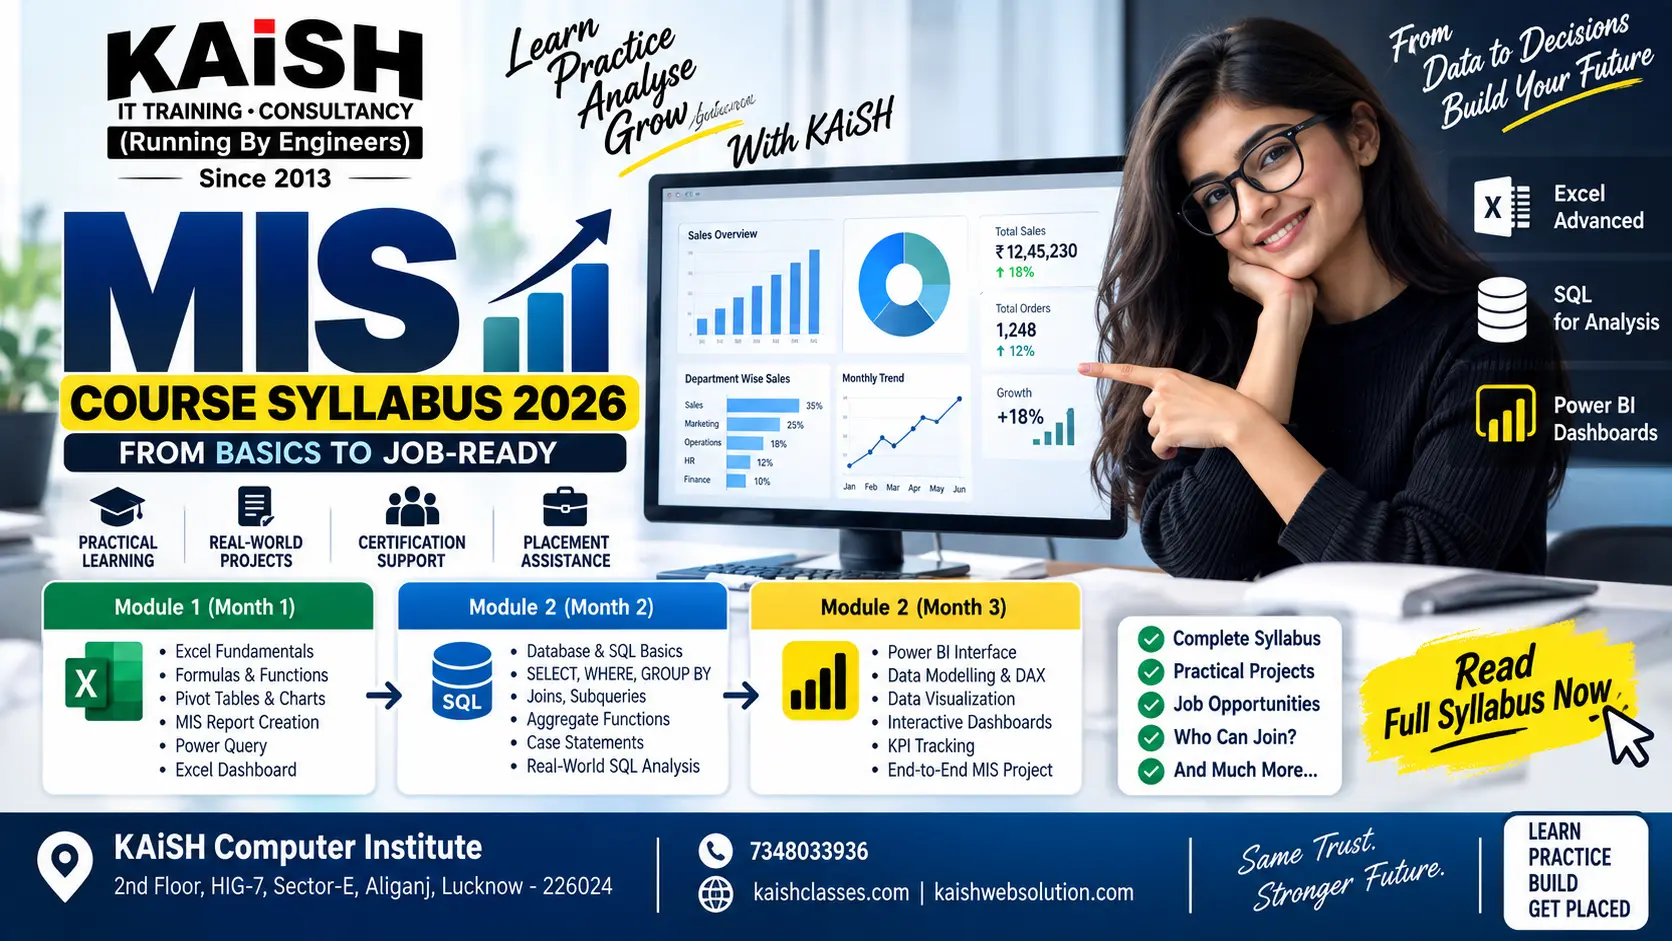
Modern MIS work is not limited to preparing Excel reports. A professional MIS Executive may need to clean data, analyse business information, prepare management reports, track KPIs and present insights through dashboards. Therefore, this 3-month MIS course focuses on Advanced Excel, MIS Reporting, SQL, Power Query, Power BI, DAX and real-world projects.
What is MIS?
MIS stands for Management Information System. In a business environment, MIS professionals collect, organize, analyse and present information that helps management monitor performance and make better decisions.
An MIS Executive may work with sales data, employee data, inventory, purchases, expenses, attendance, operations and other business information to prepare regular reports and dashboards.
MIS Course Syllabus at a Glance
| Module | Duration | Main Topics |
|---|---|---|
| Module 1 | Month 1 | Advanced Excel & MIS Reporting |
| Module 2 | Month 2 | SQL for Data Analysis |
| Module 3 | Month 3 | Power BI & Business Dashboards |
Module 1: Advanced Excel & MIS Fundamentals
The first month focuses on Excel fundamentals, advanced formulas, data cleaning, Pivot Tables and practical MIS report creation.
Excel Fundamentals
- Excel Interface & Workbook Management
- Data Entry and Formatting
- Rows, Columns, Cells and Ranges
- Sorting and Filtering
- Excel Tables
- Cell References
- Important Excel Shortcuts
Excel Formulas & Functions
- SUM, AVERAGE, COUNT, COUNTA
- MAX and MIN
- IF and Nested IF
- AND and OR
- IFERROR
- SUMIF and SUMIFS
- COUNTIF and COUNTIFS
- AVERAGEIF and AVERAGEIFS
Lookup Functions
- VLOOKUP
- HLOOKUP
- XLOOKUP
- INDEX and MATCH
- INDEX + MATCH
- Practical Lookup Scenarios
Excel Data Cleaning
- Remove Duplicates
- Handling Blank and Missing Data
- TRIM
- CLEAN
- LEFT, RIGHT and MID
- LEN
- FIND and SEARCH
- SUBSTITUTE
- CONCAT and TEXTJOIN
Date & Time Analysis
- TODAY and NOW
- DATE, DAY, MONTH and YEAR
- Month-wise Analysis
- Year-wise Analysis
- Aging Reports
- Monthly MIS Reporting
Pivot Tables & MIS Reports
- Creating Pivot Tables
- Grouping Data
- Pivot Filters
- Slicers
- Pivot Charts
- Sales Reports
- Purchase Reports
- Inventory Reports
- Employee Reports
- Performance Reports
Power Query in Excel
- Data Import
- Data Cleaning
- Data Transformation
- Merge Queries
- Append Queries
- Remove Duplicates
- Data Type Transformation
- Combining Multiple Files
- Refreshable Reports
Module 1 Practical Project
Students create a complete Monthly Sales MIS Report using Excel, formulas, Pivot Tables, charts and dashboard elements.
Module 2: SQL for Data Analysis
The second month introduces SQL and database concepts so students can work with structured business data and create analysis-ready reports.
Database Fundamentals
- What is a Database?
- DBMS Concepts
- Tables, Rows and Columns
- Primary Key
- Foreign Key
- Relationships
- Relational Databases
SQL Fundamentals
- CREATE
- ALTER
- DROP
- INSERT
- UPDATE
- DELETE
- SELECT
Filtering & Sorting Data
- WHERE
- AND / OR
- IN
- BETWEEN
- LIKE
- IS NULL
- DISTINCT
- ORDER BY
Aggregate Functions
- SUM()
- COUNT()
- AVG()
- MIN()
- MAX()
GROUP BY & HAVING
Students learn to create practical business analysis such as:
- Customer-wise Sales
- Product-wise Sales
- Department-wise Expenses
- Month-wise Transactions
- Year-wise Revenue
- Employee-wise Performance
SQL Joins
- INNER JOIN
- LEFT JOIN
- RIGHT JOIN
- FULL JOIN
Subqueries & Nested Queries
- Simple Subqueries
- Nested Queries
- Subqueries with SELECT
- Subqueries with WHERE
- Subqueries with FROM
CASE Statement
CASE statements are used to create business categories and conditions, for example High, Medium and Low sales categories.
SQL for Real-World MIS Analysis
- Monthly Sales Analysis
- Top Customers
- Product Performance
- Revenue Analysis
- Expense Analysis
- Department Performance
- Current Month vs Previous Month Analysis
Module 2 Practical Project
Students prepare a SQL-based Business MIS Report involving customer, sales, product and monthly performance analysis.
Module 3: Power BI & Business Dashboards
The third month focuses on Power BI, data transformation, data modelling, DAX and interactive business dashboards.
Power BI Fundamentals
- Introduction to Power BI
- Power BI Desktop
- Power BI Workflow
- Data Sources
- Reports and Dashboards
- Data Visualizations
Data Import & Power Query
- Importing Excel Data
- Importing CSV Data
- Importing Multiple Tables
- Connecting Database Data
- Data Cleaning
- Data Transformation
- Merge and Append
- Custom Columns
Data Modelling
- Tables
- Relationships
- Primary and Foreign Keys
- One-to-Many Relationships
- Data Model Design
DAX Fundamentals
- Measures
- Calculated Columns
- SUM
- COUNT
- DISTINCTCOUNT
- CALCULATE
- FILTER
- ALL
- DIVIDE
- Basic Time Intelligence
Power BI Visualizations
- Bar Charts
- Column Charts
- Line Charts
- Pie and Donut Charts
- Cards
- KPI Visuals
- Tables
- Matrix
- Slicers
Business Dashboards
- Sales Dashboard
- HR Dashboard
- Inventory Dashboard
- Finance Dashboard
- Performance Dashboard
- KPI Dashboard
Interactive Reporting
- Filters
- Slicers
- Drill-down
- Cross-filtering
- Interactive Reports
- KPI Tracking
- Management Dashboards
Module 3 Practical Project
Students build an End-to-End Business Intelligence Dashboard using Excel, SQL and Power BI.
Final MIS Capstone Project
The final project combines the complete MIS workflow:
Raw Data → Excel Cleaning → SQL Analysis → Power Query → Data Modelling → Power BI Dashboard → Management Report → Business Insights
Students work with practical datasets and learn how to convert raw business data into meaningful reports and dashboards.
Tools You Will Learn in MIS Course
- Microsoft Excel
- Advanced Excel
- Pivot Tables
- Power Query
- Power Pivot
- SQL
- Power BI
- DAX
- Data Modelling
- Business Dashboards
Who Should Join an MIS Course?
- 12th Pass Students
- Graduates
- B.Com Students
- BBA Students
- BCA / B.Sc Students
- MBA Students
- Working Professionals
- Excel Learners
- Students Looking for MIS Executive Jobs
- Beginners Interested in Data Analytics
Career Options After MIS Training
- MIS Executive
- MIS Analyst
- Reporting Executive
- MIS Coordinator
- Reporting Analyst
- Data Reporting Executive
- Business Reporting Executive
- Junior Data Analyst
- Power BI Reporting Executive
- Operations Analyst
Why Learn Excel + SQL + Power BI for MIS?
Excel helps professionals manage and analyse business data, SQL helps retrieve and analyse data from databases, while Power BI helps transform analysed data into interactive dashboards and visual reports.
Learning these tools together creates a practical workflow for modern reporting and analytics: Excel → SQL → Power BI → Business Insights.
Why Choose KAiSH Computer Institute for MIS Training?
- 3 Months Practical Training
- Advanced Excel & MIS Reporting
- SQL for Data Analysis
- Power BI Dashboard Training
- Real-World Projects
- Practical Assignments
- Certification Support
- Placement Assistance
- Industry-Relevant Curriculum
- Training by Experienced Faculty
MIS Course in Lucknow
If you are searching for MIS Training in Lucknow or an MIS Executive Course in Lucknow, KAiSH Computer Institute offers a practical 3-month learning path covering Excel, SQL, Power Query, Power BI, dashboards and real-world MIS projects.
The objective is to help learners develop practical reporting and data analysis skills that can be used in office and business environments.
Frequently Asked Questions (FAQ)
What is the duration of the MIS Course?
The KAiSH MIS Training Program is designed as a 3-month program covering Excel & MIS, SQL and Power BI.
What is included in the MIS Course syllabus?
The syllabus includes Advanced Excel, Excel formulas, lookup functions, Pivot Tables, MIS reports, Power Query, SQL, joins, subqueries, Power BI, DAX, data modelling, dashboards and real-world projects.
Is SQL included in the MIS course?
Yes. SQL is included in the second module and is taught for practical business data analysis and reporting.
Is Power BI included in MIS training?
Yes. The third module focuses on Power BI, Power Query, data modelling, DAX, visualizations and interactive business dashboards.
Can beginners join this MIS course?
Yes. The course starts with Excel and MIS fundamentals and gradually moves towards SQL and Power BI.
What jobs can I target after MIS training?
Depending on your skills, experience and hiring requirements, you can target roles such as MIS Executive, MIS Analyst, Reporting Executive, Reporting Analyst, Junior Data Analyst and Power BI Reporting Executive.
Is this MIS course useful for Data Analytics?
Yes. Excel, SQL and Power BI are useful foundational tools for reporting and data analysis. The course also includes practical projects to help students apply these skills to business datasets.
Start Your MIS Learning Journey with KAiSH
Learn. Practice. Analyse. Build Real-World Reports.
Take the next step towards developing practical MIS and reporting skills with KAiSH Computer Institute.
KAiSH Computer Institute
IT Training & Consultancy | Running by Engineers | Since 2013
📞 7348033936
🌐 kaishclasses.com
🌐 kaishwebsolution.com
📍 Aliganj, Lucknow
Learn • Practice • Build • Get Placed
🔗 Related Articles
https://www.kaishclasses.com/power-bi-course-lucknow.php👉 Want to start your career? Join KAiSH Computer Institute today.