
Which Course Is Best for Data Analysis? 2026 Guide
📚 Table of Contents
The best course for data analysis combines Advanced Excel, SQL, Power BI, Python, statistics and real-world projects. Learn the right roadmap to become a job-ready Data Analyst.
📌 Quick Summary
If you are searching for “Which course is best for data analysis?”, you are probably comparing courses in Excel, SQL, Power BI, Python, Data Analy...
This article is written for beginners who want to learn and build a career in Which Course Is Best for Data Analysis? 2026 Guide.
If you are searching for “Which course is best for data analysis?”, you are probably comparing courses in Excel, SQL, Power BI, Python, Data Analytics, Data Science and Business Analytics.
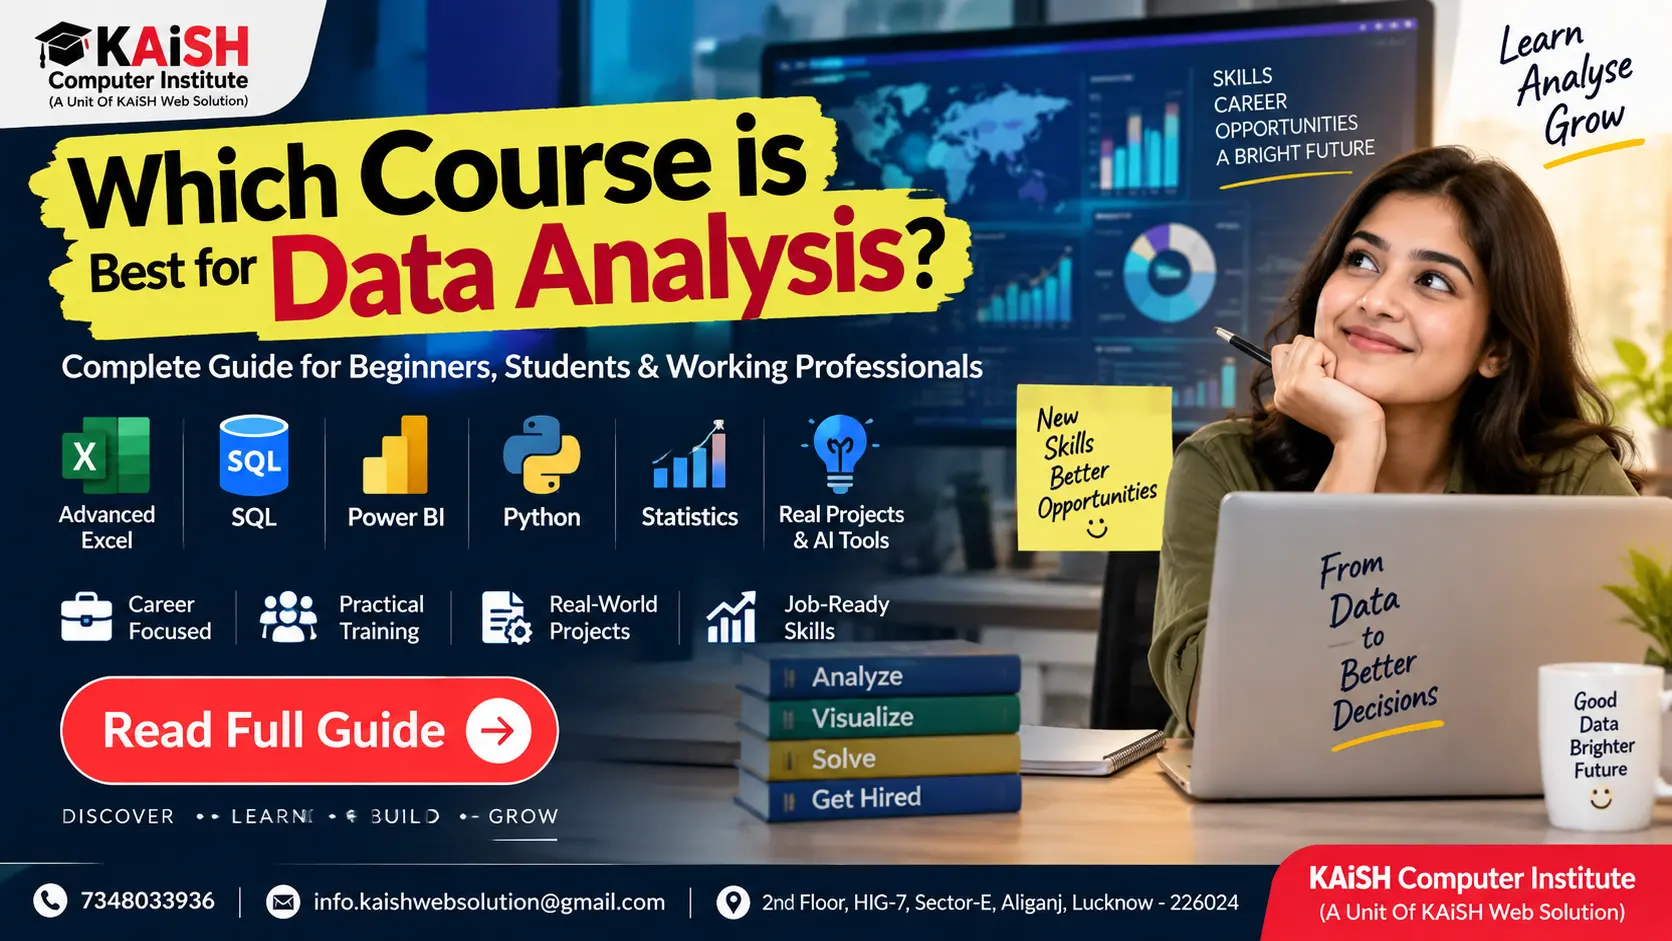
The good news is that you do not need to learn everything at once. For most beginners, the best approach is to learn the core Data Analytics tools in a practical sequence: Advanced Excel → SQL → Power BI → Python → Statistics → Real-World Projects → AI-assisted Analytics.
A good Data Analytics course should not simply teach software tools. It should help you understand how to clean data, analyse information, create dashboards and convert numbers into useful business insights.
Which Course Is Best for Data Analysis?
For a beginner, a complete Data Analytics course covering Advanced Excel, SQL, Power BI, Python, Statistics, Data Visualization and practical projects is generally a better choice than learning only one software tool.
The right course should teach you how to move from raw data to meaningful insights:
Raw Data → Data Cleaning → Data Analysis → Visualization → Dashboard → Business Insights
What Should a Good Data Analytics Course Include?
1. Advanced Excel
Excel is one of the best starting points for beginners in Data Analytics. A professional course should go beyond basic formulas and include advanced functions, PivotTables, data cleaning, Power Query and dashboards.
- XLOOKUP and VLOOKUP
- INDEX and MATCH
- IF, SUMIFS and COUNTIFS
- Text and Date functions
- Pivot Tables and Pivot Charts
- Conditional Formatting
- Data Cleaning
- Power Query
- Excel Dashboards
Advanced Excel is particularly useful for MIS reporting, business reporting and day-to-day data analysis.
2. SQL for Data Analysis
SQL is one of the most important skills for anyone planning a career in Data Analytics. SQL allows analysts to retrieve, filter, aggregate and join information stored in databases.
A good course should cover:
- SELECT
- WHERE
- ORDER BY
- GROUP BY
- HAVING
- Aggregate Functions
- JOINS
- Subqueries
- CASE Statements
- CTEs
- Window Functions
For example, an analyst can use SQL to identify the top customers, highest-selling products or monthly revenue from thousands of database records.
3. Power BI
Power BI is an important Business Intelligence and data visualization tool. It helps analysts transform data into interactive reports and dashboards.
A practical Power BI course should cover:
- Power BI Desktop
- Data Import
- Power Query
- Data Cleaning
- Data Modelling
- Relationships
- DAX
- Measures
- KPIs
- Interactive Dashboards
- Filters and Slicers
- Dashboard Storytelling
The combination of Excel + SQL + Power BI is particularly useful for reporting, Business Intelligence and Data Analytics roles.
4. Python for Data Analysis
Python is not necessarily the first tool a beginner needs to learn, but it becomes increasingly useful as you progress in Data Analytics.
For Data Analytics, learners should focus on practical Python rather than trying to become software developers immediately.
- Python Fundamentals
- Lists, Tuples and Dictionaries
- Conditions and Loops
- Functions
- NumPy
- Pandas
- Matplotlib
- Data Cleaning
- Data Transformation
- Data Visualization
5. Statistics
Data Analysis is not only about software. You also need to understand what the numbers mean.
A beginner-friendly Data Analytics course should introduce:
- Mean
- Median
- Mode
- Range
- Variance
- Standard Deviation
- Percentiles
- Correlation
- Probability
- Sampling
- Basic Hypothesis Testing
6. Real-World Projects
One of the biggest differences between simply completing a course and becoming job-ready is practical project experience.
A good Data Analytics course should give learners opportunities to work with realistic datasets and solve business problems.
Examples of Data Analytics Projects
- Sales Analytics Dashboard
- HR Analytics Dashboard
- E-commerce Analytics
- Customer Analysis
- Financial Analysis
- Student Performance Analysis
- Marketing Analytics
Projects help learners understand how Excel, SQL, Power BI and Python work together in an actual analytics workflow.
Data Analytics vs Data Science: Which One Should You Choose?
Data Analytics and Data Science are related, but they are not exactly the same.
| Data Analytics | Data Science |
|---|---|
| Excel | Python |
| SQL | Machine Learning |
| Power BI | Deep Learning |
| Dashboards | Predictive Models |
| Business Insights | Advanced Statistics |
If you are completely new to the field, Data Analytics can be a practical starting point. After developing a strong foundation, you can move toward advanced analytics, Machine Learning or Data Science.
Can BBA, B.Com and Non-Technical Students Learn Data Analytics?
Yes. Data Analytics is not limited to Computer Science students.
Students and professionals from BBA, B.Com, MBA, Economics, Management, Engineering and other backgrounds can start learning Data Analytics.
For beginners, a practical sequence is:
Excel → SQL → Power BI → Python → Projects
This gradual approach makes it easier to develop technical and analytical skills without trying to learn everything simultaneously.
How Long Does It Take to Learn Data Analytics?
The time required depends on your background, learning speed and practice schedule.
| Stage | Learning Focus |
|---|---|
| Stage 1 | Advanced Excel |
| Stage 2 | SQL |
| Stage 3 | Power BI |
| Stage 4 | Python |
| Stage 5 | Statistics & Projects |
| Stage 6 | Portfolio & Interview Preparation |
Is Generative AI Useful for Data Analytics?
Yes. Generative AI can become a useful productivity assistant for Data Analysts.
AI tools can help with:
- Understanding SQL queries
- Writing and explaining formulas
- Generating Python code
- Explaining errors
- Creating analytical questions
- Documentation
- Dashboard ideas
- Data-cleaning suggestions
- Brainstorming business insights
However, AI should be treated as an assistant rather than a replacement for analytical thinking. A Data Analyst still needs to understand the data, validate results and decide whether an insight actually makes business sense.
How to Choose the Best Data Analytics Course?
Before joining any Data Analytics course, don't choose only on the basis of advertisements or certificates.
Check whether the course provides:
- Practical training
- Advanced Excel
- SQL
- Power BI
- Python
- Data Cleaning
- Real-world datasets
- Projects
- Dashboard development
- Interview preparation
- Portfolio guidance
- Career guidance
Why Consider KAiSH Computer Institute for Data Analytics in Lucknow?
If you are searching for a Data Analytics course in Lucknow, the learning environment matters as much as the syllabus.
KAiSH Computer Institute provides career-focused computer and IT training in Lucknow, with Data Analytics training built around practical tools such as Advanced Excel, SQL, Power BI and Python.
The focus is not simply on learning individual software tools. Learners can work toward understanding the complete analytics workflow—from data cleaning and analysis to visualization, dashboards and business reporting.
For students and working professionals who prefer structured classroom learning, practical assignments and guided learning, an institute-based approach can be useful compared with trying to learn multiple tools independently from disconnected online resources.
KAiSH's Data Analytics program is available in Aliganj, Lucknow, making it an option worth comparing when you are evaluating Data Analytics training institutes based on curriculum, practical exposure, projects and learning support.
Explore Data Analytics Course at KAiSH Computer Institute →
Data Analyst Roadmap for Beginners
Start → Excel → SQL → Power BI → Statistics → Python → Projects → Portfolio → Interview Preparation → Data Analyst
Once you build this foundation, you can explore advanced areas such as Business Intelligence, Advanced Analytics, Machine Learning and Data Science.
Final Answer: Which Course Is Best for Data Analysis?
If you are starting your Data Analytics journey, the best option is not necessarily the course with the biggest syllabus.
Choose a course that teaches the right skills in the right sequence.
The ideal learning path is:
Advanced Excel + SQL + Power BI + Python + Statistics + Data Visualization + Real-World Projects + AI
The ultimate goal should not be simply saying, “I completed a Data Analytics course.”
The goal should be:
“I can take raw data, clean it, analyse it, create meaningful dashboards and explain the insights clearly.”
If you are looking for practical Data Analytics training in Lucknow, compare institutes based on their curriculum, projects, practical sessions, trainer support and career guidance. KAiSH Computer Institute is one option learners can consider when looking for structured Data Analytics training in Lucknow.
Frequently Asked Questions
Which course is best for data analysis?
A comprehensive Data Analytics course covering Advanced Excel, SQL, Power BI, Python, Statistics and real-world projects is a strong choice for beginners.
Is Excel enough to become a Data Analyst?
Excel is an important foundation, but learning SQL, Power BI and Python can provide a broader Data Analytics skill set.
Is SQL necessary for Data Analytics?
SQL is an important skill for Data Analysts because it allows them to retrieve, filter, aggregate and analyse data stored in databases.
Should I learn Power BI or Tableau?
Both are useful Business Intelligence tools. Power BI is a practical choice for beginners, particularly when combined with Excel and SQL.
Can BBA or B.Com students learn Data Analytics?
Yes. Students from BBA, B.Com, MBA, Economics, Management and other backgrounds can learn Data Analytics by starting with Excel and gradually progressing to SQL, Power BI and Python.
Is Python compulsory for beginners?
Python is not compulsory at the beginning. Many learners start with Excel and SQL, then add Power BI and Python as they progress.
How can I become job-ready in Data Analytics?
Build strong fundamentals in Excel, SQL and Power BI, learn Python and statistics, practise with real datasets, create portfolio projects and prepare for practical interviews.
Where can I learn Data Analytics in Lucknow?
Learners in Lucknow can compare Data Analytics institutes based on curriculum, practical training, projects, trainer support and career guidance. KAiSH Computer Institute in Aliganj is one option for learners looking for structured Data Analytics training.
Conclusion
The best Data Analytics course is not the one that simply gives you a certificate. It is the one that helps you develop the ability to convert raw data into meaningful insights and business decisions.
For beginners, the most useful foundation is Excel + SQL + Power BI + Python + Statistics + Projects, with Generative AI increasingly becoming a useful productivity layer.
Learn the tools. Practise with real data. Build projects. Understand the business problem. Then let your skills speak for you.
🔗 Related Articles
https://www.kaishclasses.com/top-data-analytics-training-lucknow.php https://www.kaishclasses.com/blog/power-bi-training-course-lucknow-data-analytics🌐 References
https://www.microsoft.com/en-us/power-platform/products/power-bi https://www.python.org/ https://www.postgresql.org/docs/👉 Want to start your career? Join KAiSH Computer Institute today.