
Power BI Training Course in Lucknow – Learn DAX, Power Query, SQL & Data Analytics
📚 Table of Contents
Power BI Training Course in Lucknow is a practical program for students, graduates, working professionals and beginners who want to learn data analytics, business intelligence, data visualization and dashboard development. The training covers Power BI Desktop, Power Query, data cleaning, data modeling, DAX, interactive dashboards, Power BI Service, SQL and practical analytics projects.
📌 Quick Summary
Power BI Training Course in Lucknow – Learn Data Analytics & Business Intelligence Power BI Training Course in Lucknow is designed for students, ...
This article is written for beginners who want to learn and build a career in Power BI Training Course in Lucknow – Learn DAX, Power Query, SQL & Data Analytics.
Power BI Training Course in Lucknow – Learn Data Analytics & Business Intelligence
Power BI Training Course in Lucknow is designed for students, graduates, working professionals, Excel users and beginners who want to develop practical skills in Data Analytics, Business Intelligence, data visualization and interactive dashboard development.
Microsoft Power BI is a business intelligence and data visualization platform that helps users connect data from different sources, transform and model data, create interactive reports and dashboards, and generate useful business insights.
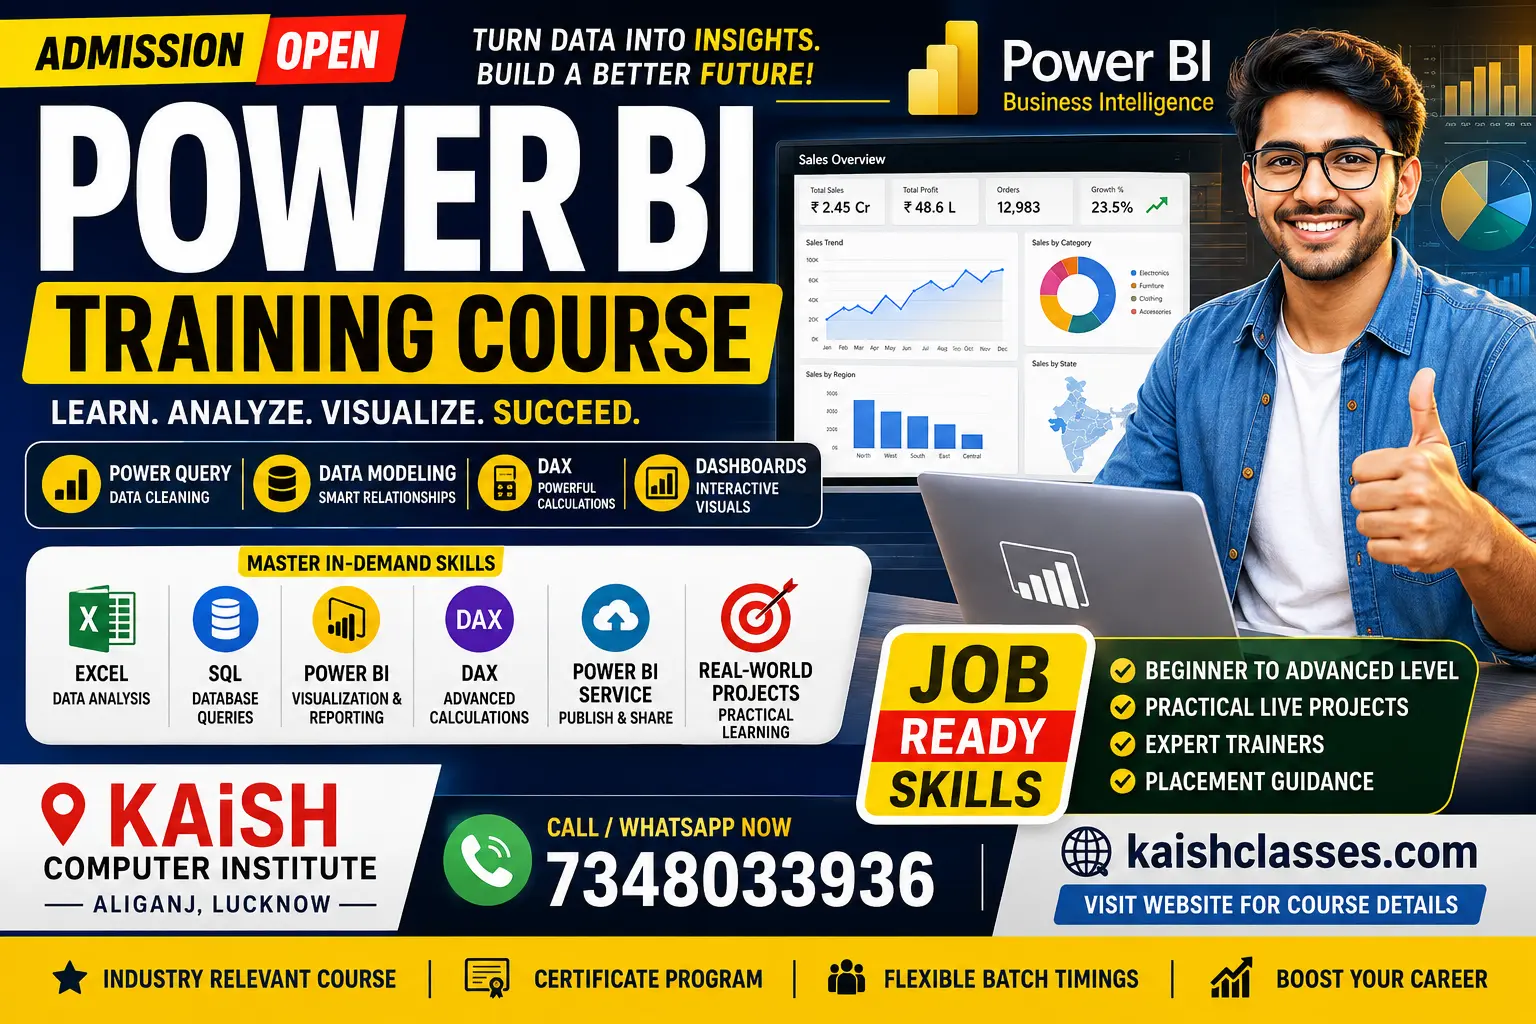
At KAiSH Computer Institute, Aliganj, Lucknow, learners can develop Power BI skills through practical training covering Power Query, data cleaning, data modeling, DAX, dashboard development, Power BI Service and real-world analytics projects.
What is Power BI?
Power BI is a Microsoft business intelligence and data visualization platform used to connect, transform, analyze and visualize data.
In simple words, Power BI converts raw data into interactive reports, dashboards, charts and business insights.
Power BI can be used to:
- Connect data from different sources
- Clean and transform data
- Create relationships between tables
- Build data models
- Create DAX calculations
- Design interactive dashboards
- Analyze business performance
- Create KPI reports
- Share reports and dashboards
Why Learn Power BI in 2026?
Businesses generate large amounts of data from sales, finance, marketing, HR, customers, inventory and operations. Power BI helps organizations convert this data into understandable visual reports and dashboards.
For learners interested in Data Analytics and Business Intelligence, Power BI can become an important skill when combined with Excel, SQL, data modeling and analytical thinking.
Power BI Training Course in Lucknow – What Will You Learn?
A practical Power BI course should cover the complete analytics workflow, from importing raw data to creating professional dashboards.
1. Power BI Desktop
Learn the fundamentals of Power BI Desktop and understand how reports are created.
- Power BI interface
- Data import
- Report pages
- Charts and visuals
- Filters
- Slicers
- KPI cards
- Interactive reports
2. Power Query – Data Cleaning & Transformation
Power Query is used to import, clean and transform data before analysis.
- Data cleaning
- Removing duplicates
- Handling missing values
- Changing data types
- Merge Queries
- Append Queries
- Conditional Columns
- Custom Columns
- Data Transformation
- ETL workflow
What is ETL?
ETL means Extract, Transform and Load. It refers to the process of extracting data from sources, transforming it into a useful format and loading it for analysis.
3. Data Modeling in Power BI
Data modeling is an important part of Power BI because it determines how different tables and data entities are connected for analysis.
- Tables
- Relationships
- Primary Keys
- Foreign Keys
- Cardinality
- Fact Tables
- Dimension Tables
- Star Schema
- Date Tables
4. DAX – Data Analysis Expressions
DAX (Data Analysis Expressions) is the formula language used in Power BI to create calculations and analytical expressions.
Important DAX concepts include:
- Measures
- Calculated Columns
- Calculated Tables
- Row Context
- Filter Context
- CALCULATE
- FILTER
- SUM
- SUMX
- COUNT
- DISTINCTCOUNT
- Time Intelligence
- YTD and MTD calculations
- Year-over-Year analysis
5. Data Visualization & Dashboard Design
Power BI is not only about creating charts. A professional dashboard should communicate important information clearly and help users answer business questions.
- Bar Charts
- Column Charts
- Line Charts
- Pie and Donut Charts
- Cards
- KPI Visuals
- Tables
- Matrix
- Maps
- Slicers
- Drill-through
- Tooltips
- Bookmarks
- Conditional Formatting
Raw Data → Data Cleaning → Data Modeling → Analysis → Visualization → Business Insight
6. Power BI Service
Power BI learning can also include Power BI Service for publishing, managing and sharing reports.
- Publishing reports
- Workspaces
- Dashboards
- Report sharing
- Data refresh
- Scheduled refresh
- Apps
- Data gateways
- Security concepts
Power BI + SQL – Why Learn Both?
SQL is commonly used to retrieve and analyze data stored in relational databases, while Power BI is used extensively for modeling, visualization and business reporting.
SQL helps with:
- Database querying
- Filtering records
- Joins
- Grouping
- Aggregation
- Data extraction
Power BI helps with:
- Data modeling
- Interactive dashboards
- Data visualization
- Business reporting
- Data analysis
Power BI + Excel + SQL + Python
For a broader Data Analytics skill set, Power BI can be combined with Excel, SQL and Python.
| Skill | Primary Use |
|---|---|
| Excel | Data preparation and analysis |
| SQL | Database querying and data extraction |
| Power BI | Dashboards and Business Intelligence |
| Python | Advanced data analysis and automation |
| DAX | Power BI calculations |
| Power Query | Data transformation |
Who Should Join Power BI Training?
Power BI training can be suitable for:
- College Students
- Graduates
- BCA Students
- B.Tech Students
- MBA Students
- Working Professionals
- MIS Executives
- Excel Users
- Business Professionals
- Data Analytics Beginners
- Job Seekers
- Career Switchers
Is Power BI Suitable for Beginners?
Yes. Beginners can learn Power BI step by step. Advanced programming knowledge is not required to start learning Power BI.
However, learning Excel, SQL, DAX and basic data analysis concepts can help learners develop stronger Power BI skills.
Power BI Learning Roadmap for Beginners
- Understand basic data concepts
- Learn Power BI Desktop
- Learn Power Query
- Understand Data Modeling
- Learn Basic DAX
- Learn Advanced DAX
- Learn Data Visualization
- Learn Dashboard Design
- Learn Power BI Service
- Build Real-World Projects
- Create a Data Analytics Portfolio
- Prepare for Interviews
Practical Power BI Projects
Project-based learning helps learners understand how Power BI is used for real analytical problems.
Sales Analytics Dashboard
- Total Sales
- Revenue
- Profit
- Region-wise Sales
- Product Performance
- Monthly Sales Growth
HR Analytics Dashboard
- Total Employees
- Department Analysis
- Attrition
- Salary Analysis
- Experience Analysis
Financial Dashboard
- Revenue
- Expenses
- Profit
- Budget
- Variance Analysis
Marketing Analytics Dashboard
- Leads
- Campaign Performance
- Conversion Rate
- Customer Acquisition
- Marketing ROI
Power BI Training Course in Aliganj, Lucknow
KAiSH Computer Institute provides Power BI training in Aliganj, Lucknow, with a practical and project-oriented approach. The current Power BI course information includes Power Query, DAX, data modeling, dashboard development, Power BI Service and practical projects.
The institute's Power BI training is suitable for learners who want to develop practical Business Intelligence and Data Analytics skills.
Power BI Course – Quick Facts
| Feature | Details |
|---|---|
| Course | Power BI Training |
| Location | Aliganj, Lucknow |
| Level | Beginner to Advanced |
| Core Tool | Microsoft Power BI |
| Key Skills | Power Query, DAX, Data Modeling |
| Additional Skills | SQL and Data Analytics |
| Projects | Sales, HR, Finance and Business Analytics |
| Learning Approach | Practical and Project-Based |
| Suitable For | Students, Graduates and Professionals |
| Career Area | Data Analytics and Business Intelligence |
Power BI Certification – What Should You Know?
Learners interested in Microsoft's Power BI certification ecosystem can explore the Microsoft Certified: Power BI Data Analyst Associate (PL-300) pathway.
Certification preparation and the official certification examination are separate. Completing a training course should not be presented as automatic certification.
Power BI Career Opportunities
Power BI skills can support different data and reporting-oriented career paths, depending on a candidate's overall skills, qualifications, experience and employer requirements.
- Data Analyst
- Business Intelligence Analyst
- Power BI Developer
- MIS Analyst
- Reporting Analyst
- Business Analyst
- Data Visualization Analyst
Important: No training course can guarantee a job. Employment depends on skills, projects, qualifications, interview performance and employer requirements.
How Long Does It Take to Learn Power BI?
The learning time depends on your existing knowledge, learning speed and the depth of skills you want to develop.
A focused Power BI program can be completed in a shorter period, while a broader Data Analytics learning path may require additional time for Excel, SQL, Python, statistics and projects.
Is Power BI Difficult to Learn?
Power BI is manageable for beginners when learned step by step.
Instead of trying to learn every feature at once, beginners should start with Power BI Desktop, Power Query and basic visualization, then progress toward data modeling, DAX, advanced dashboards and real-world projects.
Frequently Asked Questions About Power BI Training
1. What is Power BI?
Power BI is Microsoft's business intelligence and data visualization platform used to connect, transform, model, visualize and analyze data.
2. Is Power BI good for beginners?
Yes. Beginners can start with Power BI Desktop and gradually learn Power Query, data modeling, DAX and dashboard development.
3. Is coding required for Power BI?
Advanced programming is not required to start learning Power BI. However, DAX, SQL and analytical concepts are useful for advanced work.
4. What is DAX in Power BI?
DAX stands for Data Analysis Expressions. It is used to create calculations and analytical expressions in Power BI.
5. What is Power Query?
Power Query is used to connect, clean and transform data before it is analyzed in Power BI.
6. Is SQL useful with Power BI?
Yes. SQL is useful for querying and preparing data stored in relational databases and can complement Power BI skills.
7. Can Excel users learn Power BI?
Yes. Excel knowledge can provide a useful foundation for understanding tables, formulas, data and business reporting.
8. Can students learn Power BI?
Yes. Students from technical, management, commerce and other backgrounds can learn Power BI with proper guidance and practical practice.
9. What projects should I make while learning Power BI?
Sales, HR, Finance, Marketing, Inventory and Business Performance dashboards are useful project categories for building practical skills.
10. Can Power BI help in a Data Analyst career?
Yes. Power BI is an important data visualization and Business Intelligence skill used in many Data Analytics workflows.
11. Is Power BI certification necessary?
Certification is not mandatory for every Data Analyst role. Practical skills, analytical thinking, projects and relevant experience are also important.
12. Where can I learn Power BI in Lucknow?
Learners looking for classroom Power BI training in Lucknow can explore KAiSH Computer Institute in Aliganj and compare the curriculum, practical projects, learning duration and career support before enrolling.
Start Learning Power BI in Lucknow
Build practical skills in Power BI, Power Query, DAX, Data Modeling, SQL and Data Visualization through project-oriented learning.
KAiSH Computer Institute, Aliganj, Lucknow
Admission / New Batches Open
Call: 7348033936
Website: kaishclasses.com
Conclusion
Power BI is a valuable tool for transforming data into interactive reports, dashboards and business insights. For beginners, the best approach is to learn Power BI step by step along with Power Query, data modeling and DAX, followed by practical projects.
For learners targeting broader Data Analytics roles, combining Excel + SQL + Power BI + Python + DAX + Data Visualization can create a stronger technical skill set.
If you are looking for Power BI Training in Lucknow, choose a learning program that focuses not only on software features but also on data cleaning, analytical thinking, dashboard design and real-world projects.
🔗 Related Articles
https://www.kaishclasses.com/power-bi-course-lucknow.php https://www.kaishclasses.com/blog/data-analytics-course-in-lucknow https://www.kaishclasses.com/blog/data-analytics-training-in-lucknow https://www.kaishclasses.com/blog/how-to-become-a-data-analyst-in-lucknow https://www.kaishclasses.com/advanced-excel-course-in-lucknow.php🌐 References
https://learn.microsoft.com/en-us/training/powerplatform/power-bi https://learn.microsoft.com/en-in/training/courses/pl-300t00 https://learn.microsoft.com/en-us/training/paths/data-analytics-microsoft/👉 Want to start your career? Join KAiSH Computer Institute today.