
Data Analytics Training in Lucknow: Learn the Skills Companies Actually Need
📚 Table of Contents
Learning Data Analytics is not about collecting certificates. It is about learning how to turn raw data into insights, dashboards and decisions.
📌 Quick Summary
What If Data Could Become Your Career? Every day, businesses generate huge amounts of data. Sales transactions, customer enquiries, website visits,...
This article is written for beginners who want to learn and build a career in Data Analytics Training in Lucknow: Learn the Skills Companies Actually Need.
What If Data Could Become Your Career?
Every day, businesses generate huge amounts of data. Sales transactions, customer enquiries, website visits, marketing campaigns, employee records, expenses and operational reports are all producing information.
But raw data is not useful until someone can understand it.
That is where a data analyst comes in.
If you are searching for Data Analytics Training in Lucknow, the real question should not simply be, “Which course should I join?”
The better question is:
“Will this training actually teach me how to work with real data?”
This guide explains what modern Data Analytics training should include, which tools matter, what beginners should learn first and how practical training can help you build a stronger analytics foundation.
What Is Data Analytics?
Data Analytics is the process of collecting, cleaning, transforming, analyzing and interpreting data to discover useful information.
In simple words, a data analyst takes numbers and converts them into meaningful answers.
For example:
- Which product is selling the most?
- Why did sales decrease this month?
- Which marketing campaign generated more leads?
- Which customers are returning?
- Which location is performing better?
- What trend can be seen in the last 12 months?
These questions may look simple, but answering them correctly requires a combination of technical skills, analytical thinking and business understanding.
Why Data Analytics Training Is Becoming Important
Businesses are increasingly making decisions using data instead of relying only on assumptions.
A company may have thousands of customer records, sales transactions or website interactions. Someone needs to convert that information into reports and insights that management can understand.
This is why analytics skills can be useful across industries.
Banking, finance, education, healthcare, retail, e-commerce, marketing, IT services, logistics and manufacturing can all use data to understand performance.
For students and professionals in Lucknow, learning analytics can therefore open a pathway toward multiple technology and business-oriented roles.
What Should You Learn in Data Analytics Training?
A good training program should not focus on one software tool alone.
Modern analytics involves a complete workflow.
- Understanding the problem
- Collecting data
- Cleaning data
- Analyzing data
- Creating visualizations
- Finding insights
- Communicating results
The tools support this process.
A practical Data Analytics Training in Lucknow can therefore include Excel, SQL, Power BI, Python, statistics, data visualization and AI-assisted analytics workflows.
Excel: The First Step for Many Beginners
Microsoft Excel remains one of the most accessible tools for working with structured data.
Beginners can use Excel to understand fundamental concepts such as sorting, filtering, formulas, tables and data organization.
As skills improve, learners can move toward:
- Advanced Excel formulas
- PivotTables
- PivotCharts
- Conditional formatting
- Data cleaning
- Lookup functions
- SUMIFS and COUNTIFS
- Dashboard creation
- Power Query
Excel is especially useful because many organizations still use spreadsheets for reporting and operational analysis.
SQL: The Language Behind Business Data
When data is stored inside relational databases, SQL becomes an essential skill.
SQL allows analysts to retrieve and manipulate information from databases.
Important concepts include:
- SELECT
- WHERE
- ORDER BY
- GROUP BY
- HAVING
- JOINS
- Subqueries
- Aggregate functions
- Window functions
The important thing is not memorizing SQL commands.
The real skill is learning how to use SQL to answer business questions.
For example, instead of simply learning GROUP BY, a student can be asked:
“Which five products generated the highest revenue last quarter?”
Now SQL becomes a problem-solving tool rather than a theoretical subject.
Power BI: Turning Data Into Dashboards
Data becomes much easier to understand when presented visually.
Microsoft Power BI is widely used for creating interactive reports and dashboards.
Students can learn how to:
- Import data
- Clean data using Power Query
- Build data models
- Create relationships
- Use DAX
- Create interactive charts
- Build KPI cards
- Create filters and slicers
- Design business dashboards
A dashboard should not simply contain colourful charts.
A good dashboard answers questions.
For example, a sales dashboard might immediately show revenue, profit, target achievement, top products and regional performance.
Python for Data Analytics
Python can take Data Analytics skills to another level.
It is particularly useful when datasets become larger, repetitive tasks need automation or advanced analysis is required.
Common Python libraries for analytics include:
- NumPy
- Pandas
- Matplotlib
- Seaborn
Pandas is especially important because it provides powerful tools for working with tabular data.
A learner can use Python to load CSV or Excel files, clean records, transform columns, calculate statistics and explore patterns.
Why Statistics Still Matters
Learning tools without understanding numbers can create weak analytical skills.
Statistics helps an analyst understand what the data is actually saying.
Important beginner concepts include:
- Mean
- Median
- Mode
- Range
- Variance
- Standard deviation
- Percentiles
- Correlation
- Probability
You do not need to become a mathematician to start Data Analytics.
But you should understand enough statistics to interpret data responsibly.
Where Does Generative AI Fit Into Data Analytics?
This is where modern analytics is changing.
Generative AI tools can help analysts explain formulas, generate SQL examples, understand Python errors, brainstorm dashboard ideas and accelerate repetitive tasks.
But AI should be treated as an assistant rather than an unquestioned source of truth.
A professional analyst still needs to verify:
- Data accuracy
- Calculations
- Business definitions
- Assumptions
- Outliers
- Final conclusions
The combination of Data Analytics fundamentals and responsible AI usage can make the learning process more productive.
Can Beginners Learn Data Analytics?
Yes.
You do not necessarily need an advanced programming background to begin.
Beginners can start with spreadsheet fundamentals and gradually progress toward SQL, Power BI, Python and analytics projects.
The important factor is consistency.
Learning five tools in five days is less useful than spending several weeks understanding how those tools solve actual problems.
Data Analytics Training for Students
Students from B.Tech, BCA, BBA, B.Com, MBA and other backgrounds can explore Data Analytics depending on their career goals.
For students, analytics training can complement academic education by adding practical exposure.
Instead of learning only theoretical concepts, students can work with datasets and build projects that demonstrate their skills.
Data Analytics for Working Professionals
Working professionals can also use analytics to improve their existing career profile.
For example, a marketing professional can learn marketing analytics.
A finance professional can explore financial reporting and analysis.
A sales professional can build sales dashboards.
This combination of domain knowledge and analytics can be valuable because the professional already understands the business context.
Why Real Projects Matter
Imagine completing a course where you watched hundreds of tutorials but never worked on a complete dataset.
Now compare that with someone who has built:
- Sales Dashboard
- Customer Analysis Project
- Marketing Performance Dashboard
- Employee Analytics Report
- E-commerce Analysis
The second learner has something concrete to demonstrate.
Projects force you to solve problems independently.
That is why practical project work should be an important part of Data Analytics Training in Lucknow.
How to Choose Data Analytics Training in Lucknow
Before enrolling, do not compare institutes only by fees.
Compare the learning experience.
Check the Syllabus
Does it include Excel, SQL, Power BI, Python and practical analytics?
Check Practical Work
Will you actually work with datasets or mostly watch demonstrations?
Check Projects
Ask whether students build complete projects from raw data to final dashboard.
Check Trainer Support
Can you ask questions when you get stuck?
Check Curriculum Updates
Does the program consider modern AI-assisted analytics workflows?
What Makes Classroom Training Different?
For some learners, classroom training provides an environment where questions can be answered immediately and practical work can be supervised.
It can also create a regular learning schedule.
However, classroom training is valuable only when the learner actually practices.
The best training environment is one where the student is not merely watching the trainer operate the software.
The student should be doing the work.
What Can You Build After Learning Data Analytics?
Once the fundamentals are understood, learners can build different types of analytical projects.
- Sales Analytics Dashboard
- Customer Segmentation Analysis
- Employee Analytics Dashboard
- Marketing Campaign Analysis
- Financial Performance Dashboard
- E-commerce Sales Analysis
- Inventory Analytics
- Student Performance Dashboard
Each project can demonstrate a different analytical skill.
Possible Career Paths After Data Analytics Training
Depending on skills, experience and job requirements, learners may explore roles such as:
- Data Analyst
- Business Analyst
- MIS Analyst
- Reporting Analyst
- BI Analyst
- Junior Data Analyst
- Data Visualization Analyst
Job titles and requirements vary between organizations, so learners should always compare their skill set with current job descriptions.
Is Data Analytics Only for IT Students?
No.
Data is used in technology as well as business functions.
A commerce graduate may bring strong financial understanding.
A management student may understand business processes.
A marketing professional may understand customer behaviour.
The analytical tools can then add a technical layer to that existing knowledge.
The Most Important Skill Is Not a Tool
Excel can change.
Power BI can change.
AI tools can change.
Programming libraries can change.
But analytical thinking remains valuable.
An analyst should be able to look at a problem and ask:
What happened?
Why did it happen?
What evidence supports the conclusion?
What should we investigate next?
That mindset is more important than memorizing hundreds of commands.
Why Learn Data Analytics in Lucknow?
Lucknow has a growing ecosystem of students, professionals, startups, businesses, educational institutions and service organizations.
For a learner who prefers local classroom interaction, finding a suitable Data Analytics Training in Lucknow can make regular practice more convenient.
For learners around Aliganj and nearby areas, local training can also reduce the friction of travelling long distances for every class.
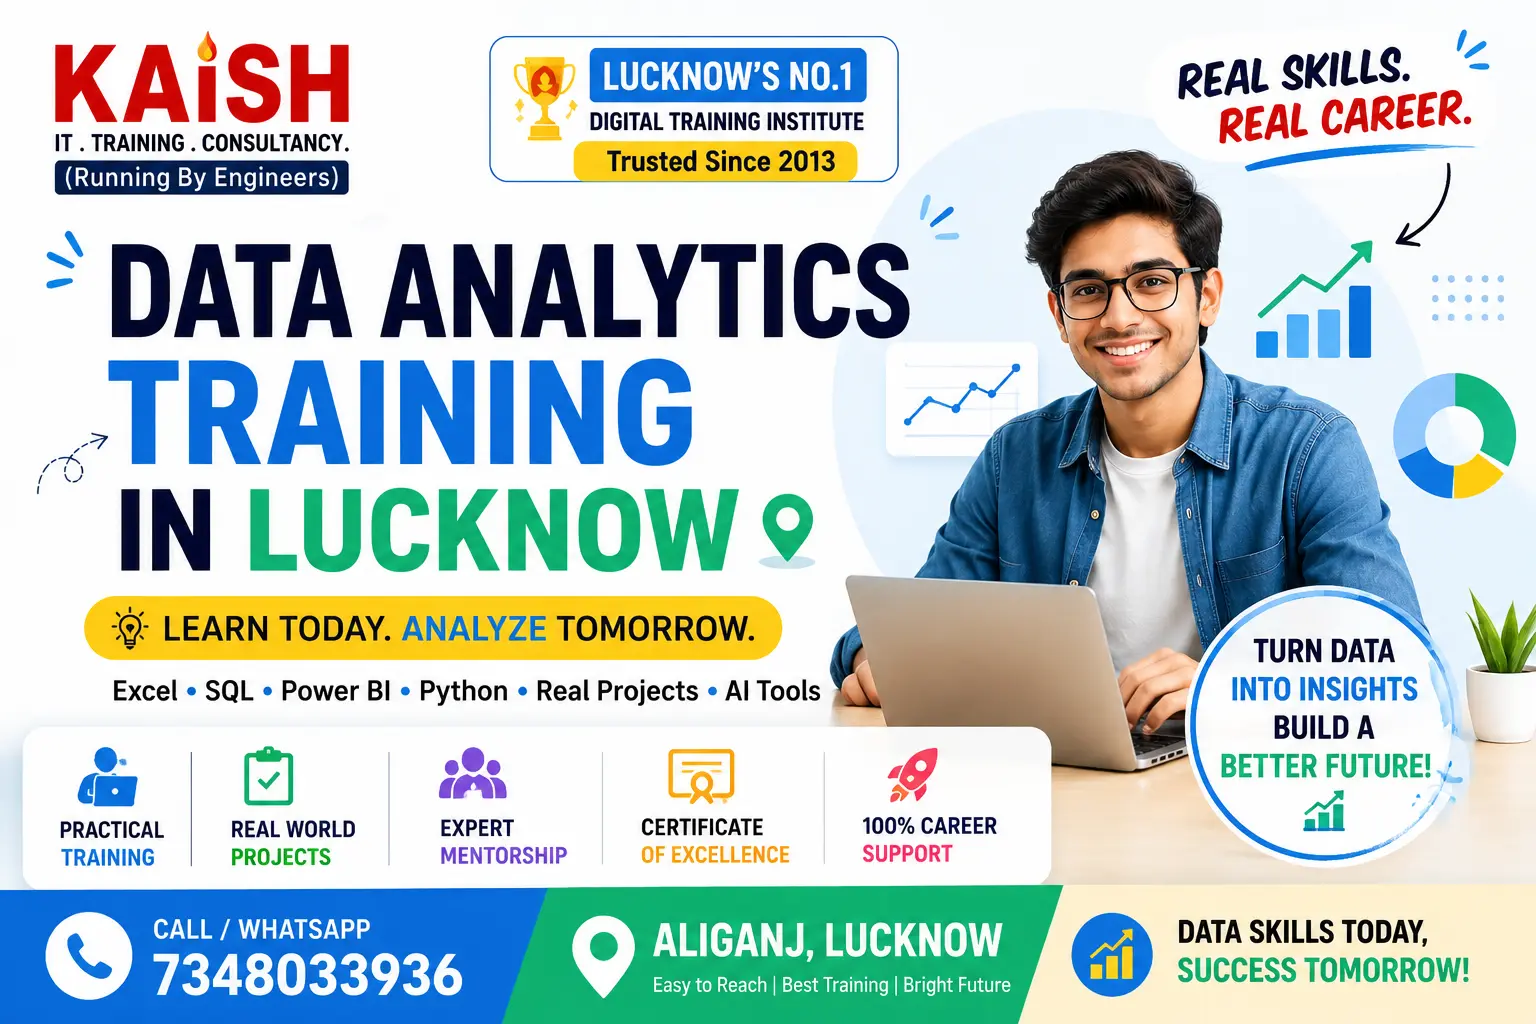
Data Analytics Training at KAiSH
KAiSH Computer Institute in Aliganj, Lucknow focuses on practical technology and digital skills training.
The Data Analytics learning pathway can introduce students to important tools such as Excel, SQL, Power BI and Python along with data visualization, projects and modern AI-assisted workflows.
The objective is simple:
Learn the concept → Practice the skill → Build the project → Understand the insight.
Frequently Asked Questions
What is Data Analytics Training?
Data Analytics Training teaches learners how to collect, clean, analyze and visualize data using tools such as Excel, SQL, Power BI and Python.
Which tools are important for a beginner?
Excel, SQL and Power BI provide a strong foundation. Python can be added as the learner progresses.
Can a non-programmer learn Data Analytics?
Yes. Beginners can start with Excel and gradually learn SQL, Power BI and Python.
Is Python compulsory for Data Analytics?
Not for every analytics role, but Python is a valuable skill for advanced analysis, automation and larger data workflows.
Is Power BI useful for Data Analysts?
Power BI is useful for transforming data into interactive reports, dashboards and business insights.
How long does it take to learn Data Analytics?
The time depends on the learner's background, practice schedule and depth of learning. Building a strong foundation requires consistent practice rather than simply completing video lessons.
Is Data Analytics a good career option?
Analytics skills are relevant across many industries. Career opportunities depend on skills, projects, experience, location and current employer requirements.
What should I check before joining training?
Check the syllabus, practical sessions, projects, trainer support, learning environment and curriculum relevance.
Ready to Start?
You can spend months watching random tutorials.
Or you can follow a structured learning path.
The choice is yours.
If you are looking for Data Analytics Training in Lucknow, start by understanding the skills you actually want to build.
Your first dashboard could be the beginning of something much bigger.
Visit KAiSH Computer Institute, Aliganj, Lucknow, or contact the institute to learn more about the Data Analytics training program.
🌐 References
https://www.microsoft.com/en-in/microsoft-365/excel https://www.microsoft.com/en-us/power-platform/products/power-bi https://www.python.org/👉 Want to start your career? Join KAiSH Computer Institute today.